SEMANA 5 - Análise de Sistema Elétrico no Power World
- esqueletrica

- 7 de abr. de 2015
- 2 min de leitura
Análise básica e intuitiva de um sistema hipotético simples usando o aplicativo PowerWolrd.
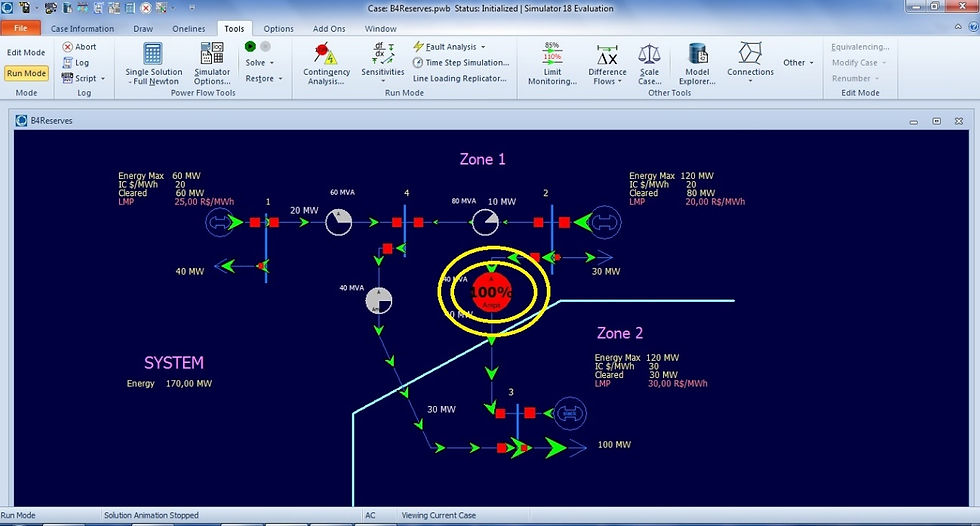
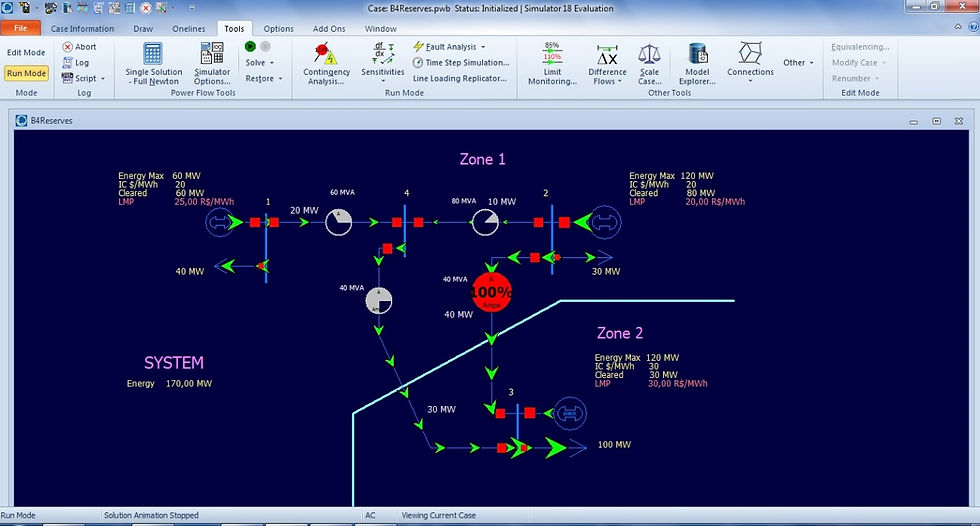
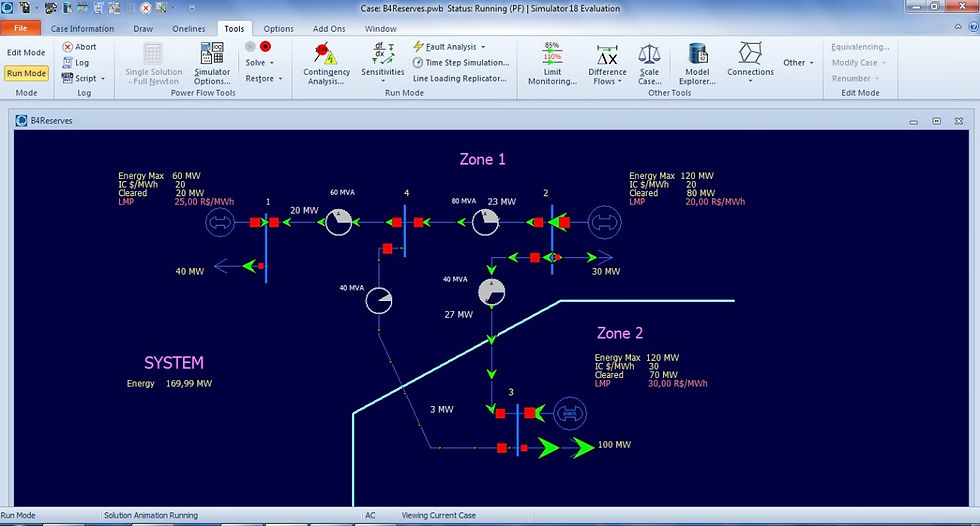
Tem-se, num primeiro momento o sistema em funcionamento com todos os três geradores ligados, gerando uma energia total de 170 MW.Vê-se também sinais de sobrecarregamento de linha transmissão na região destacada.Sendo atingido o máximo suportado na linha.
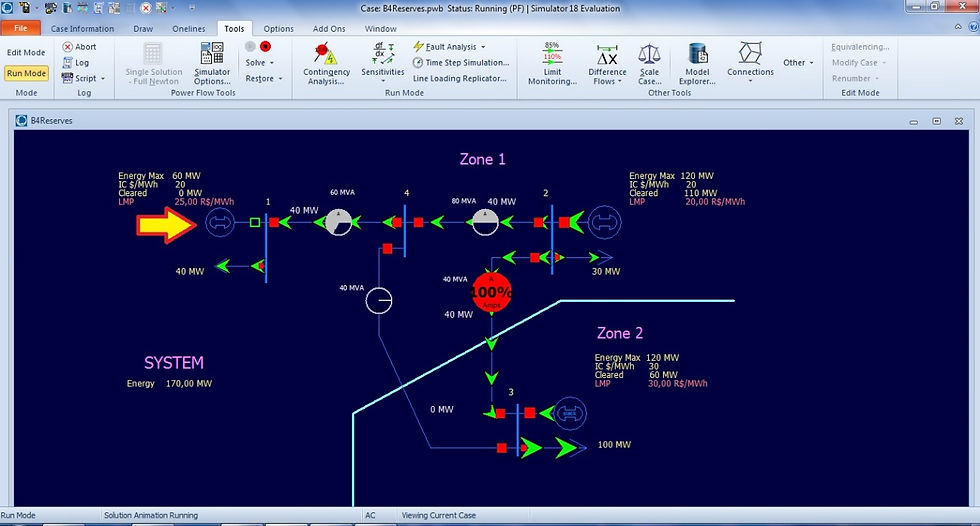
Desligando-se o primeiro gerador, indicado pela seta, não vê-se mudanças significativas que apontem uma queda do sistema, o que ocassionaria um possível blackout. Todavia, uma das linhas ficou completamente inutilizada.

Religando-se o primeiro gerador e desligando-se o segundo, tem-se uma nova situação. Não há linhas sobrecarregadas, nem linhas absolutamente inoperantes.

Repetindo-se o processo e deixando operantes apenas os geradores 1 e 2, tem-se uma situação visevelmente mais crítica onde uma linha opera com 96% e outra hipotéticamente com 154% de sua capacidade, o que significaria uma queda do sistema e possíveis ausência dp fornecimento de nergia.
Religando-se o terceiro gerador, vê-se um novo perfil no sistema. A linha que liga a barra 4 à 3, não possui a mesma eficiência que na situação inicial, o que poderia representar danos causados pela queda de funcionamento dos geradores.
CONCLUSÃO: a partir de analises visuais e intuitivas, chega-se a conclusão de que mesmo pequenas alterações pontuais nos sistema causam alterações significativas no sistema como um todo. No caso analisado, vê-se ,contudo, uma importância acentuada do gerador 3, já que sua retirada provocou um sobrecarregamento de 154% de uma linha.
WEEK 5 – Analysis of a electric system in Power World
Basic and intuitive analysis of a simple hypothetical system using the Power World app .
In the beginning , we had the system working with all the three generators turned on , creating a total energy of 170MW. We can also see signals of overload in the transmission lines at the highlighted area. Reaching the maximum supported in the line .
Turning of the first generator, pointed by the arrow ,we can’t see any significant change that indicate a failure in the system , what would cause a blackout . However , a line become completely useless .
Restarting the first generator and turning off the second one , we got a new situation .
There are no overloaded lines , nor useless lines .
Repeating the process and maintaining just the generators 1 and 2 operating , we could see a clearly critical situation ,with a line operating with 96% and another , hypothetically , with 154% of its capacity , what would cause a system outage , interrupting the energy supply .
Restarting the third generator we can see a new situation in the system . The line that connect the bar 3 and 4 , doesn’t keep the same efficiency as in the beginning situation , what could represent a damage caused by the interruption in the operation of the generators .
CONCLUSION : From visuals and intuitive analysis , we can conclude that little changes in the system can cause significant changes in the whole system . In the presented case , we could see the great importance of the generator 3, since it’s withdraw caused a overload of 154% in a line .


Comentários